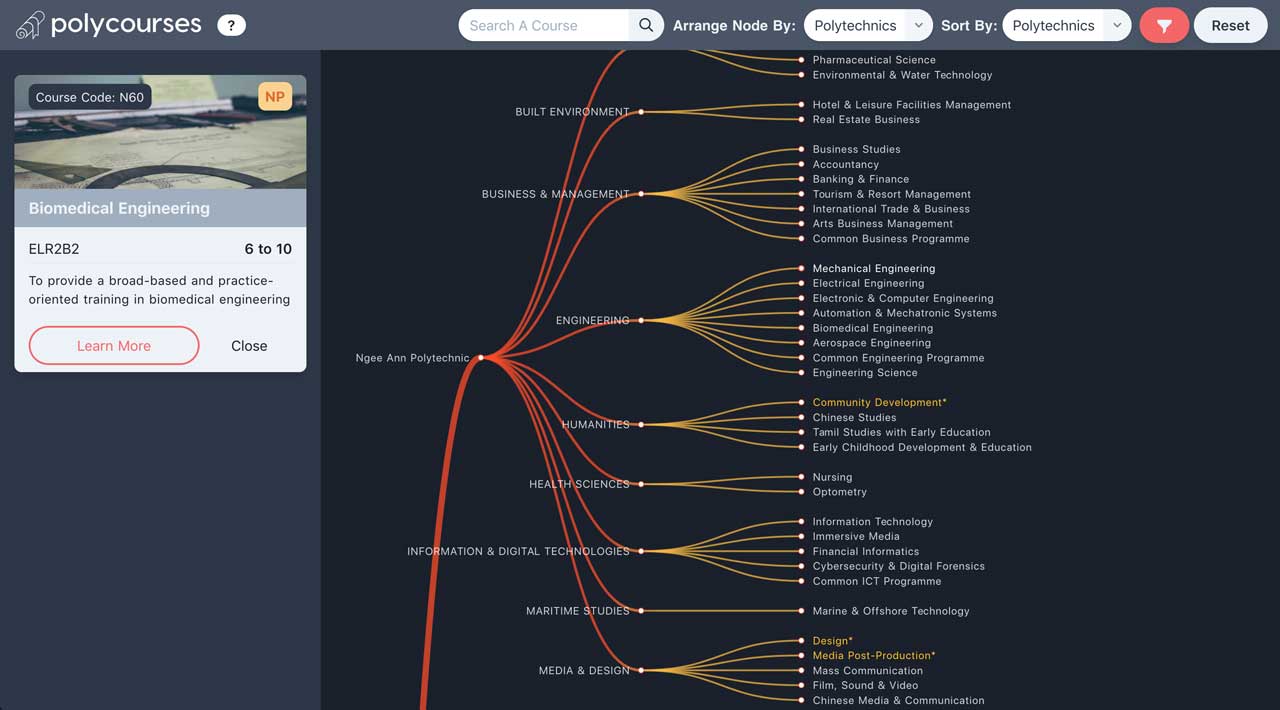
A personal project of mine that has been on the back burner for a while. Finally I got it completed (Sort of). This is a cool visualisation tool that consolidates all diploma courses available at our 5 local Singapore polytechnics. Data sources from data.gov.sg and polytechnic.edu.sg.
Even after 4 years of graduating, d3.js still haunts me. During my final year project, I had a nightmare trying to make the visualisation work with the project requirements. That is why I love it. D3.js is a powerful javascript library that enables you to create really amazing visualisation. Bar chart? Err no. Yawns. Line Chart? Nope. Collapsible Tree Diagram? YES.

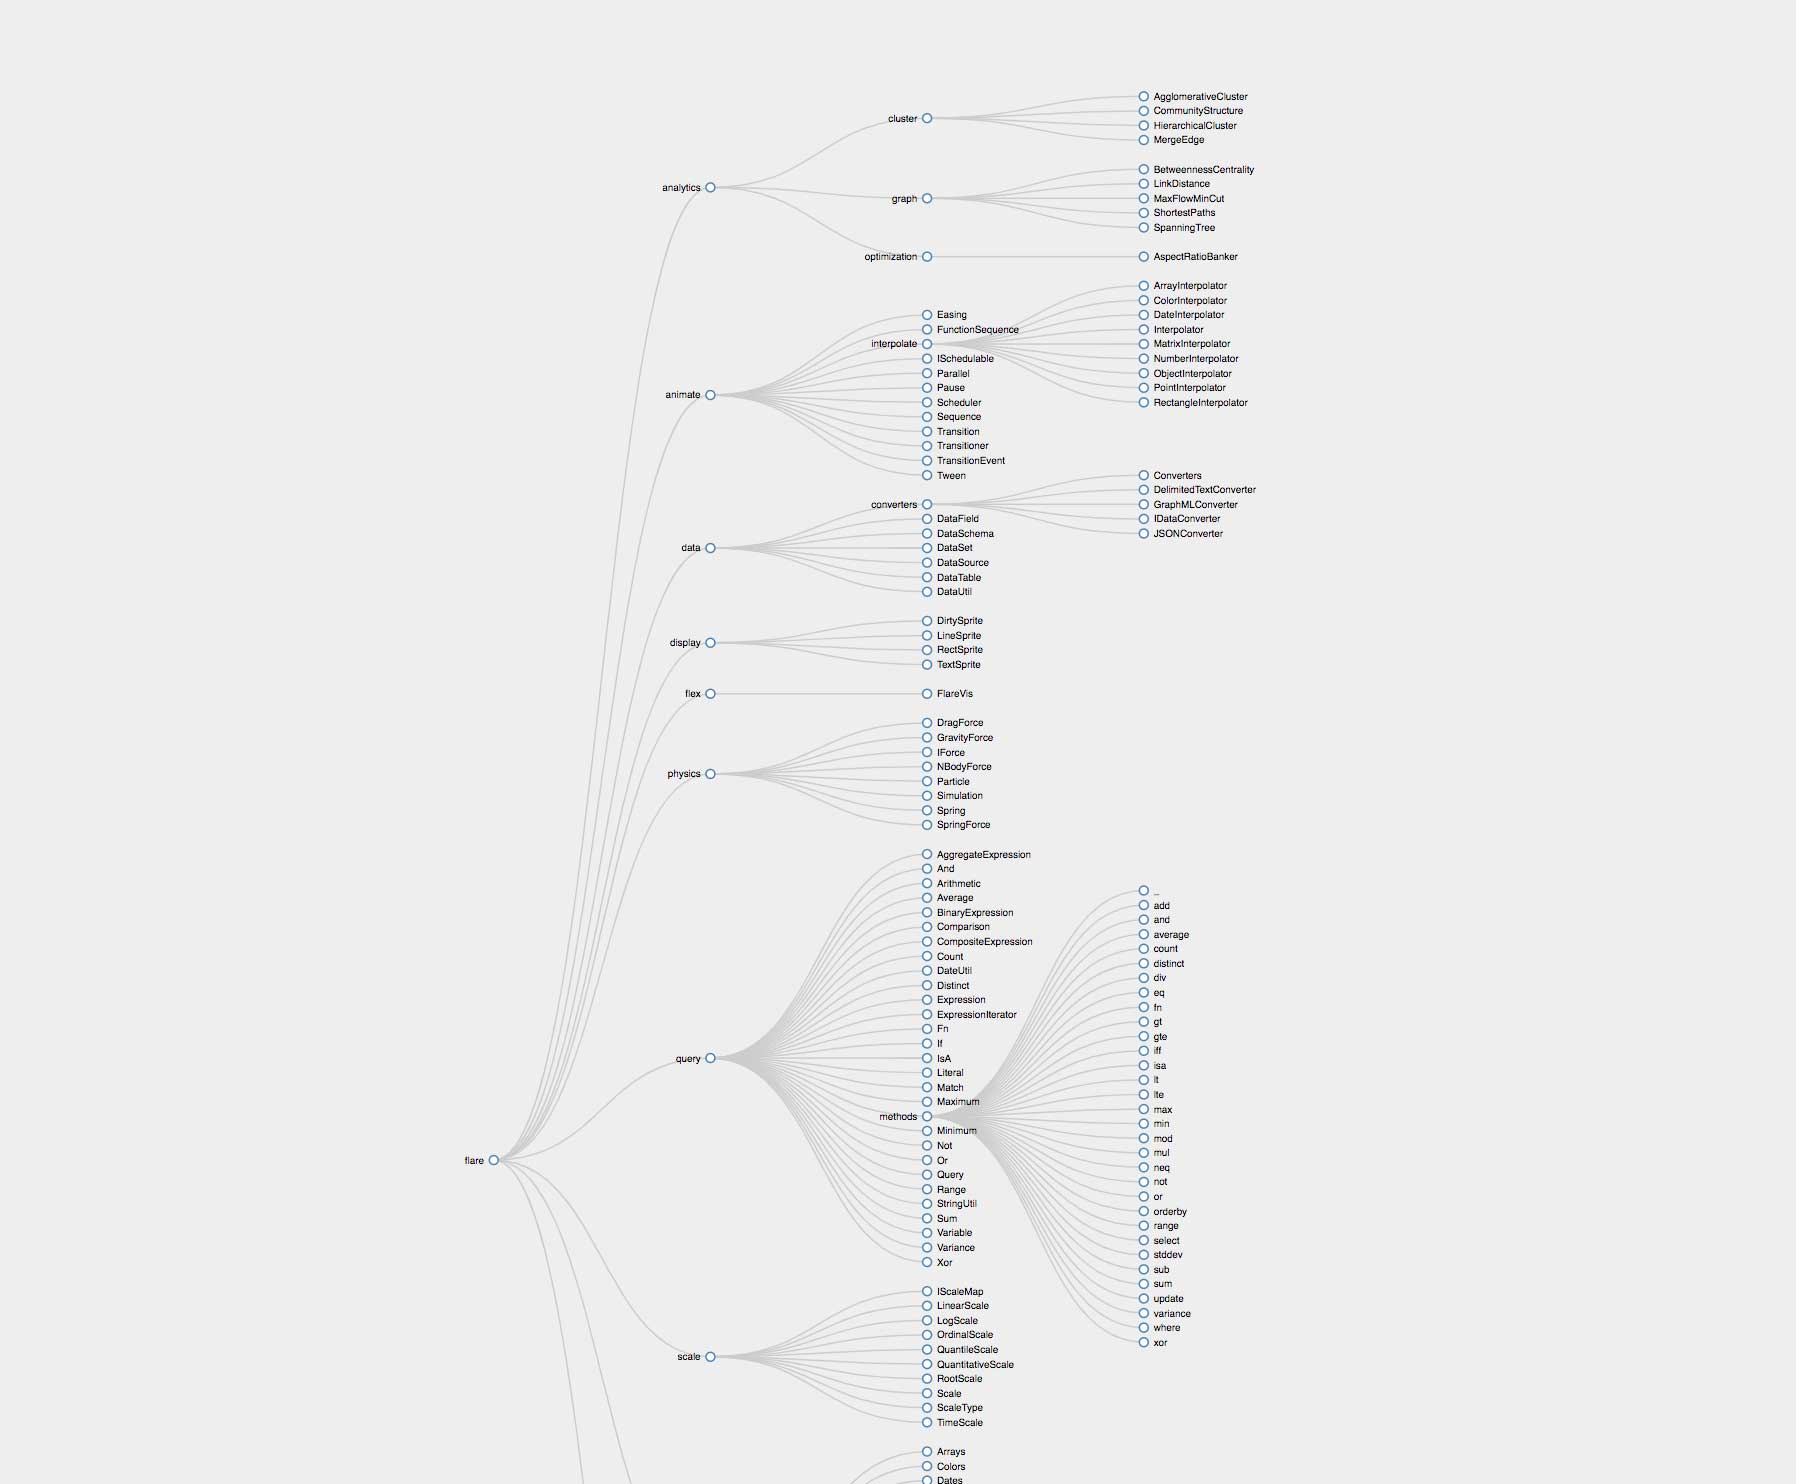
There are many visualisation tools available for D3.js but for this project purposes, I went ahead and used the collapsible Tree Diagram. Well, you might think, it is easier to just display the entire course list in a table and scroll through the data. However, you wouldn’t be able to see the different clusters of courses available within a school. And obviously, it looks way cooler and amazing. You can take a look at an example here.

Polycourses is built with Nuxt.js, Taildwind.css, D3.js and lodash. The list of courses are available at polytechnic.edu.sg and more detail descriptions are available at data.gov.sg.
The CSV data from polytechnic.edu.sg was first converted into a JSON and imported into the Nuxt.js app.
[
  {
    "COURSE_ACAD_YR": "2020/21",
    "POLY": "NYP",
    "JAE_COURSE_CODE": "C33",
    "COURSE_TITLE": "Animation & Visual Effects",
    "JAE_COURSE_CLUSTER": "MEDIA & DESIGN",
    "JAE_ELR2B2": "-",
    "ELR2B2_YEAR": "-",
    "COURSE_URL": "https://www.nyp.edu.sg/schools/sidm/full-time-courses/animation_and_visual_effects.html",
    "NEW_COURSE": "Yes"
  },
  {
    "COURSE_ACAD_YR": "2020/21",
    "POLY": "NYP",
    "JAE_COURSE_CODE": "C34",
    "COURSE_TITLE": "Common Business Programme",
    "JAE_COURSE_CLUSTER": "BUSINESS & MANAGEMENT",
    "JAE_ELR2B2": "7  to 17",
    "ELR2B2_YEAR": 2019,
    "COURSE_URL": "http://www.nyp.edu.sg/schools/sbm/full-time-courses/common-business-programme.html",
    "NEW_COURSE": "No"
  },...
From there, it can be filtered based on the clusters and polytechnics. The course code is used to pull more descriptive information from data.gov.sg.
Due to the nature of different datasets, some description may not be available. Some data are outdated as well. I may include other statistical data like total intake/graduates etc in the near future. But in the meantime, have a go!
Polycourses

